Pharmacology describes pharmacokinetics (PK) – what the body does to the drug and pharmacodynamics (PD) – what the drug does to the body. What happens to the drug in the body is inextricably tied to the effect the drug has on the body.
While pharmacokinetics are extremely complex, the aggregate effect is reflected in the amount of active drug reaching its target. For active drugs distributed systemically exposure to the drug can be adjusted by the dose of the drug given.
The only way to optimize a drug dose, to optimize therapeutic effect, is to know the pharmacokinetics in an individual patient. PK can be captured (in part) by measuring blood levels of the target drug. The goal of therapeutic drug monitoring (TDM) is to capture, in real time, what is happening to the drug in the body. Not all drugs require TMD to achieve optical dosing, however, chemotherapy drugs fit the profile of those which could benefit from TDM: there is a demonstrated correlation of drug blood levels to biological effects (treatment efficacy and toxicity); these drugs have a narrow therapeutic window between lack of efficacy and dose limiting toxicity.
Exposure optimization of cytotoxic drugs during chemotherapy treatment requires knowledge of the pharmacokinetic parameters describing the processes of absorption, distribution, metabolism, and excretion (ADME).
- Absorption: Absorption of drugs from the administration site into the bloodstream is the first major barrier to consider in determining the amount of drug that enters systemic circulation. For instance, orally administered drugs must pass through the intestine and liver before they are available in the blood. As a result, orally administered drugs typically demonstrate more pharmacokinetic variability than intravenously administered drugs.
- Distribution: Once a drug is absorbed, it is distributed to tissues throughout the body in the extravascular space. Distribution of drugs from the blood into organs depends on the characteristics of a drug, physiologic conditions of the tissue, and the amount of drug bound to plasma proteins.
- Metabolism: The liver is the major site of metabolism, which is mediated by numerous classes of phase I and II metabolizing enzymes. Because of the large number of enzymes involved, metabolism is a major source of inter-individual variability.
- Excretion: Drug transporters in the biliary tract and kidney facilitate the excretion of unchanged drug and metabolites from the body.
Pharmacokinetic Parameters
Following multiple dosing, the maximum and minimum concentrations of a drug are reached after achieving “steady-state.” A representative concentration versus time curve describes some pharmacokinetic parameters.
Figure 1. Pharmacokinetic Profile of a Plasma Concentration-Time Curve
AUC: Area Under The Curve
- AUC is the measure of total plasma exposure of a drug over a given time period and is determined by the administered dose and clearance of the drug. AUC is derived from the area under the plasma drug concentration versus time curve and is estimated by taking multiple concentration measurements at various time points to predict AUC.
- The AUC of antineoplastics can be estimated using limited sampling schemes, which have fewer measurements of the plasma concentrations. In comparison to more extensive pharmacokinetic sampling, limited sampling decreases cost and patient inconvenience but must be prospectively validated to ensure the AUC is accurately determined.
Steady State
- During constant infusion or multiple dosing of a drug, drug levels rise until they reach a plateau level, or steady state level, in the blood and in the tissues.
Cmin: Minimum Plasma Concentration
- Cmin is the lowest plasma drug concentration observed, also referred to as “trough” concentration.
Cmax: Maximum Plasma Concentration
- Cmax is the highest plasma drug concentration observed.
Tmax: Time To Reach Cmax
- Tmax is the time at which the highest drug concentration (Cmax) occurs following administration of an extravascular dose.
T1/2: Half-Life
- T1/2 is the time required for a given drug concentration to decrease by 50%. T1/2 is determined by the clearance and the volume of distribution.
Cl: Clearance
- Cl is a measure of the efficiency of drug removal from the blood or plasma. Removal of drug from the body is mediated by metabolism and excretion. Clearance is the ratio of the dose administered to AUC.
Vd: Volume Of Distribution
- Vd is the apparent volume of body fluids into which a drug distributes at equilibrium. Each drug has a different volume of distribution reflecting the extent of partitioning in the tissues relative to plasma.
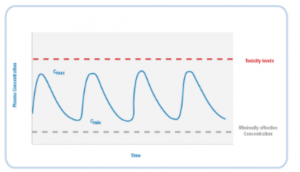
Therapeutic Window
The range of plasma concentrations between the minimally effective concentration and the concentration associated with toxicity is called the therapeutic window, or therapeutic index (figure 2). In cancer chemotherapy, drug concentrations falling below the minimally effective concentration are sub-therapeutic and may lead to cancer progression and multi-drug resistance. Most antineoplastics are associated with severe adverse reactions; therefore drug concentrations above the therapeutic index may lead to life-threatening toxicity.
Figure 2. The Therapeutic Window
There are many factors that may impact inter-individual pharmacokinetic variability, some of which are outlined in Figure 3. As a result of the high degree of variability within and among patients, equal doses of the same drug in two different individuals can result in dramatically different clinical outcomes (Figure 4).
Figure 3. Sources of Pharmacokinetic Variability
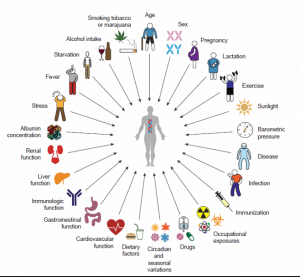
Figure 4. Equal Doses Result in Different Clinical Outcomes [2]
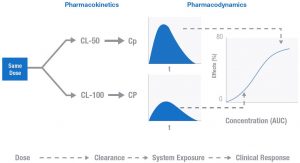
Illustrated here is the relationship between PK and PD. These two idealized patients have different clearance rates for the drug in question. This difference could result from a host of unknown differences between any individuals: activity of metabolizing enzymes, drug-drug interactions, and organ function to name just a few. The result of this difference in clearance is a difference in the systemic exposure and the clinical effect described by the Emax like model in figure 4. The difference in drug effect for these two patients could mean the difference between toxicity or response. The goal of TDM is to personalize doses for individuals to achieve the desired effect.
To review the studies addressing pharmacokinetics and pharmacodynamics, and the role of therapeutic drug monitoring in oncology, please consult our publications page.
References
1. De Jonge ME, Huitema ADR, Schellens JHM, et al. Individualized cancer chemotherapy: strategies and performance of prospective studies on therapeutic drug monitoring with dose adaptation. Clin Pharmacokinet. 2005;44(2):147-173. [http://www.ncbi.nlm.nih.gov/pubmed/15656695]
2. Hon YY, Evans WE. Making TDM work to optimize cancer chemotherapy: a multidisciplinary team approach. Clin Chem. 1998;44:388-400. [http://www.clinchem.org/content/44/2/388.long]
3. Undevia SD, Gomez-Abuin G, Ratain MJ. Pharmacokinetic variability of anticancer agents. Nat Rev Cancer. 2005;5(6):447-458. [http://www.ncbi.nlm.nih.gov/pubmed/15928675]